Big Data Business Analytics
Quintus specializes in Econometrics, a practice in which you use Quantitative Research, Big Data Science and Advanced Analytics to find valuable Business Insights.
On this page you will find some examples of Advanced Analytics projects that Quintus has done or is working on right now. Also you'll learn more about what Advanced Analytics is about in the Quick Start Guide.
Analytical Projects
For several businesses, I've worked on analytical projects. Below are some demos and previews of my work.
Quantitative Customer Journey Predictive Analytics
- Programming language
- Teradata / SAS / MicroStrategy / Celonis Process Mining
- Operating system
- Unix
- Release dates
- 2015 (MVP), 2016 (MicroStrategy Report), 2017 (Predictive Module), 2018 (Process Mining Module)
- Type
- 1-on-1 Marketing forecasting model
- Description
- The Quantitative Customer Journey Predictive Analytics big data tool developed for a major financial institution in The Netherlands, enables the 1-on-1 forecasting of retail marketing campaign effectiveness and smart target audience selection. The big data tool running on Teradata platform daily tracks customers and prospects end to end in their cross channel journeys for buying, using and retaining financial products like savings accounts, loans, residential mortgages and investments. This custom built Customer Journey suite runs nightly in order to provide next-day business intelligence insights for retail marketing campaign effectiveness using MicroStrategy dashboards. Behind the scenes the forecasting module implemented in SAS Enterprise Miner automatically optimizes running campaigns for net journey effect, such that campaigns will be automatically adjusted to the most promissing audience with regard to sales and service. Finally, the opportunity insight component discovers and signals previously hidden marketing opportunities across channels and products.
Display Banner Rotation Optimizer
- Programming language
- Teradata, MicroStrategy
- Operating system
- Unix
- Release dates
- 2017
- Type
- Display Banner 1-on-1 Reach Planning Model
- Description
- The Display Banner Rotation Optimizer consists of a first customer response eliciting mechanism based on group similarity characteristics of the client. By optimally rotating random display banners with a higher than average probability of click-through for the comparison group, online customer interactivity for retail clients of a major Dutch financial institution was increased. The statistical model behind the banner planning system was quite simple in mathematical terms, but very valuable for business value generation as no longer the default banners were served to customers. The improved approach of banner rotation resulted in a higher reach and better response on the on-site bannering channel. The results were monitored in a MicroStrategy dashboard of the marketing department.
Behavioral Customer Trend Anomaly Detection
- Programming language
- Teradata / SAS
- Operating system
- Unix
- Release dates
- 2017
- Type
- Trend Anomaly Detection model
- Description
- The Behavioral Customer Trend Anomaly Detection developed for a major financial institution in The Netherlands, automatically tracks any significant changes in many customer behavioural attributes like cross sell, channel usage and financial status. The big data tool runs on a monthly basis on the SAS Unix platform, producing actionable signals marking customers whose behavior trend has changed above/below a certain personalized threshold. Allowing the financial institution to monitor millions of customers on changing patterns in behavior and attributes, such as for purposes of acquisition, retainment or churn. The software monthly-refreshed results are easily imported into other tooling such as marketing automation and fraud detection monitoring systems.
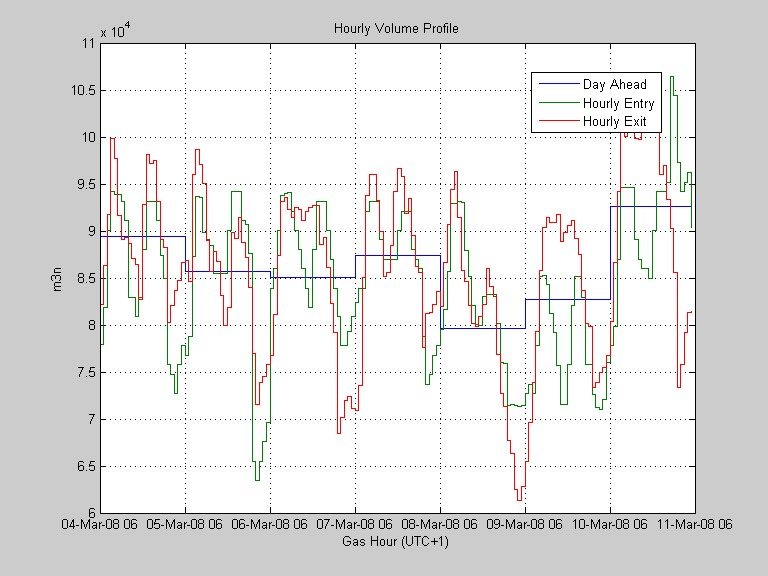
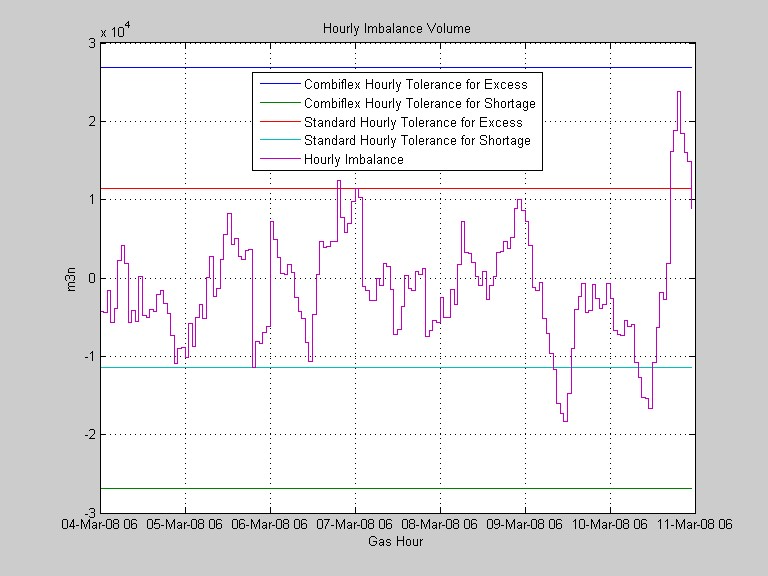
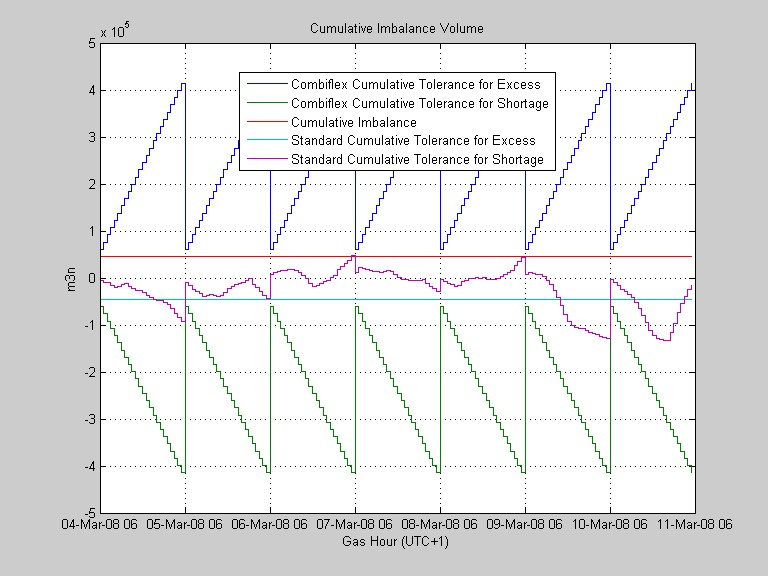
GasShipping Optimization Model
- Programming language
- MATLAB
- Operating system
- Windows Server 2003
- Release date
- 2008
- Type
- Financial computation model
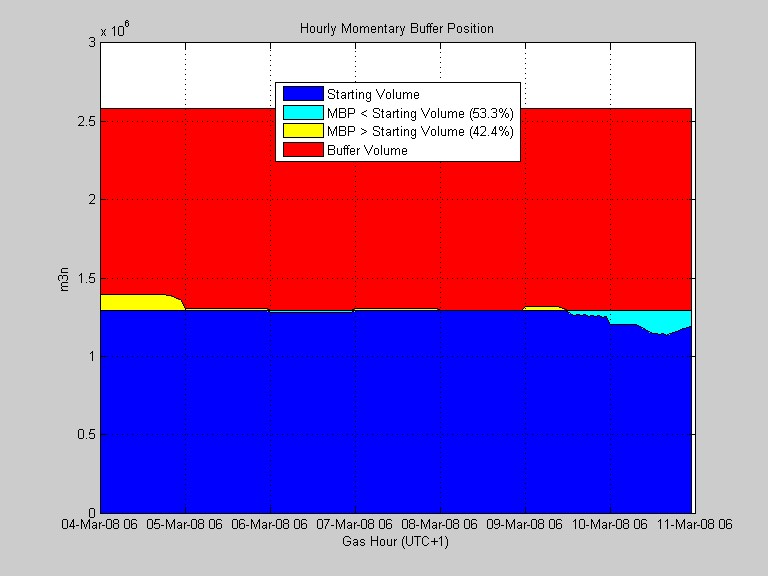
- Description
- The hourly gas shipping allocations for the energy firm needed to comply with the regulations of the Network Supervisor. Also the allocated capacity may not differ too much from the real used capacity, otherwise penalties would be given to the gas shipper. A VBA-model, with lots of sheets and formulas, was turned into an easy to maintain automation script. Computation time was improved significantly and several gas portfolio's could be calculated and optimized at the same time. Computational results were both exported to a spreadsheet as well as understandably presented in graphs and charts for management. With the newly developed software, more savings could be achieved on avoiding penalties and by better pricing.
Value At Risk Energy Trading Model
- Programming language
- MATLAB
- Operating system
- Windows Server 2003
- Release date
- 2006
- Type
- Financial computation model
- Description
- Using the mathematical programming language a financial model was turned into a automation script. With the Energy Trading Model the daily financial risk positions for the commodity portfolio (Energy, Gas, Oil) could be calculated. The thousands of Value-at-Risk positions were calculated in mere seconds, and when the model was done a user interpretable graph was displayed to give an overview of total risk. I.e. green is good low risk, red is bad high risk.
Commercial Spot Frequency Value Calculator
- Programming language
- Java
- Operating system
- Windows XP
- Release date
- 2006
- Type
- Econometric optimization model
- Description
- Software written for my Master's Thesis that implemented a mathematical model for computing the Reach and Frequency for television spot time slot programming. The program loaded a commercial break schedule as well as viewer probability matrices (e.g. retrieved from a rating agency) and then outputted the best scheduling chances in XML.
Movie Scheduler


- Programming language
- C++ / VBA / Java
- Operating system
- Windows XP
- Release date
- 2005
- Type
- Econometric optimization model
- Description
- Software written for my Bachelor's Thesis that implemented a mathematical model for allocating cinema movies to time slots in order to maximize ticket sales. The algorithm included the use of ILOG CPLEX software for column generation and branch and bound Lagrangian search. The output was written to XML and loaded back into a spreadsheet for management using VBA-code (1st screenshot). In a second iteration I improved the Graphical User Interface (GUI) to a Java interface (2nd screenshot).
Data Point Editor
- Programming language
- Java (Niagara Baja Framework)
- Operating system
- Java embedded systems
- Release date
- 2004
- Type
- Automation and productivity software
- Description
- The Data Point Editor is a GUI-tool for automating climate control embedded systems programming/configuration tasks. With the Data Point Editor building automation project manager can easily connect climate control devices like heaters, vents, lights and motion sensors, with software logic and room switches. Team productivity increased, projects were finished earlier and more business customers could be served. Over the years other colleague improved the Data Point Editor further.
PurpleSpy++ Computer Security Monitor

- Programming language
- Visual Basic
- Operating system
- Windows 95
- Release date
- 2000
- Type
- Security software
- Description
- The application was designed to protect the computer lab environment for misbehaving high-school students. PurpleSpy++ runs on the background and monitors unusual activity by the user. Observations are reported in a log for the IT-staff. In a sense, the program made it possible to have Guest Users at your Windows 95 computer, without them damaging or removing your files.
FREE DATA ANALYTICS NEWSLETTER SIGN UP
Connect 1st degree with senior consultant Quintus for exclusive access to a profound network of code developers, IT engineers, advanced analysts, data scientists, AI gurus and machine learning experts.
Receive valuable tips for steering business on factual decision making, Business Intelligence (BI) report creation mastering tricks, free data driven analytics advice, training videos and much more right in your e-mail box.
Writing to You from The Official Lowest Point in The Netherlands, near Rotterdam (The Only Way Is Up™)
Remote and hybrid analytical consulting options (Google™ Meet, Microsoft™ Teams, Zoom™, etc.) available
Message me on
LinkedIn (for Consulting Opportunities)
N.B. You'll need to confirm your free subscription by clicking the link in the e-mail sent to you. If you did not receive an e-mail please double-check the correct spelling of your e-mail addres, check your commercial mailings box or junk folder. Unsubscribe at any time to freeze your data profile.